info@sustainitsolutions.com +44 (0) 117 325 4168
< <

Visual data storytelling for a leading high-street retailer 

Objective

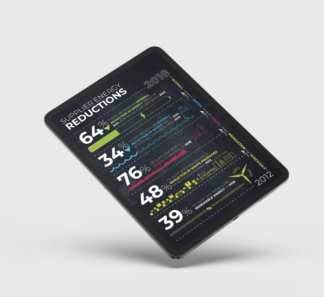
This high street titan came to us with over 9 years’ worth of data gathered from their food and ingredient suppliers. They’d collected it to report on and show the impacts their sustainability initiatives were having on their supply chain with a specific focus on five KPI areas. Faced with such a vast amount of information, they wanted to be able to communicate their data visually to their internal stakeholders without overwhelming them. Our brief was to create digestible, compelling stories that brought the numbers to life.

Industry
Retail
Employees
65,000
Services provided Data visualisation Data checking
Sustainit infographic on ipad

Action 

As experts in their chosen data management software, UL CR360, we started by checking the quality of the data, making sure it was correct and validated. Our team then worked to find and highlight stories of positive impact for each of their environmental KPIs (reducing waste to landfill, energy efficiency, water use, and food waste) before handing over to our creative team to produce visuals that followed their brand guidelines.


The report was shared across a range of audiences including shareholders, employees and the suppliers themselves. By removing the visual noise that mass amounts of data can create, our final infographic (and related graphics) was able to tell a story that everyone from the board room to the shop floor could quickly understand.

Impact 

  • Avoided greenwashing by expertly quality-checking complex data before identifying trends and patterns 
  • A library of multi-use visuals and infographics to tell stories with sustainability data 
  • Tools to communicate effectively to stakeholders, from press releases to investor reports